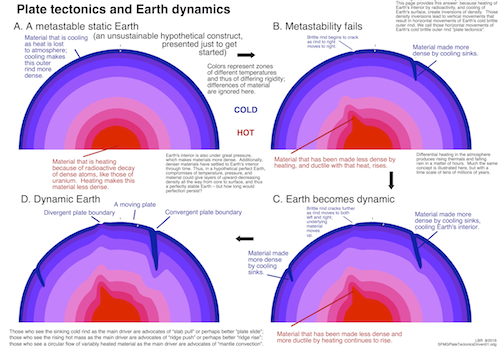
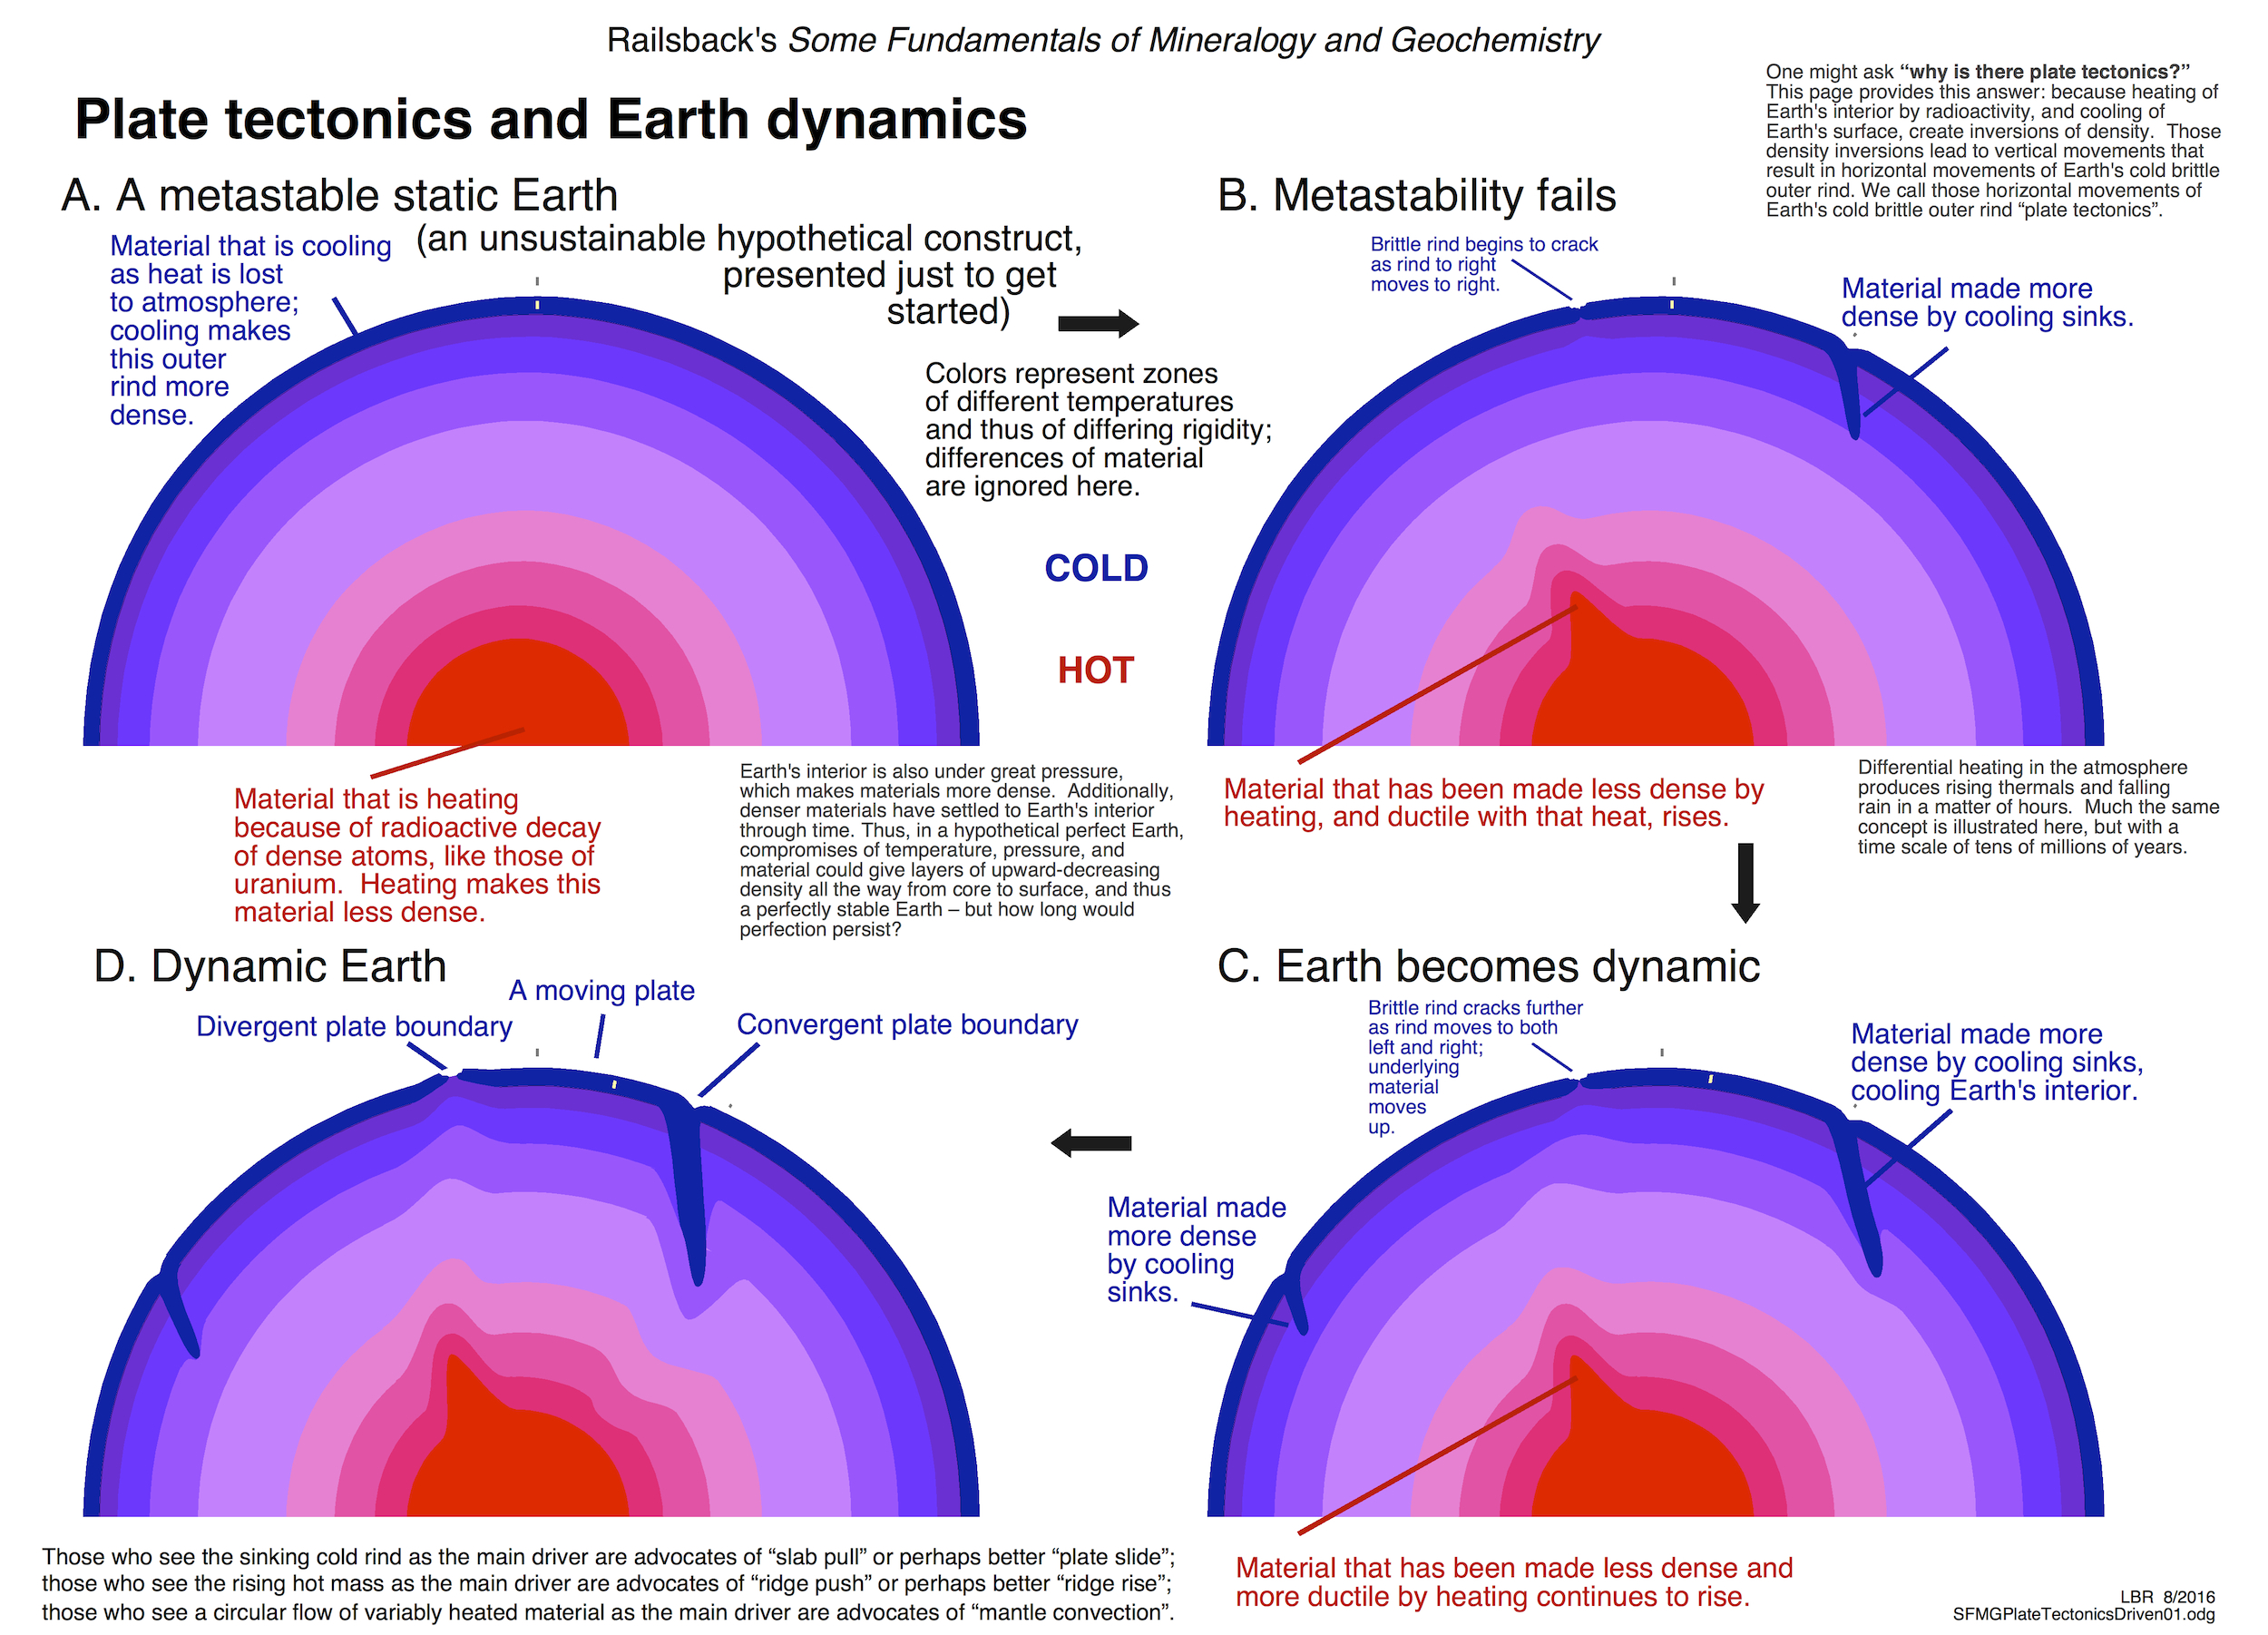
Plate Tectonics presented in a dynamic perspective
 |
Entire document as a jpeg Entire document as a pdf
|
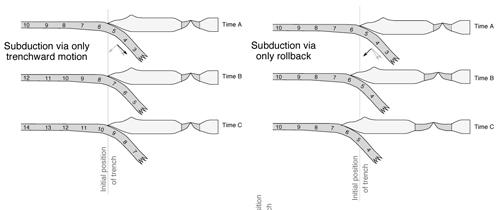
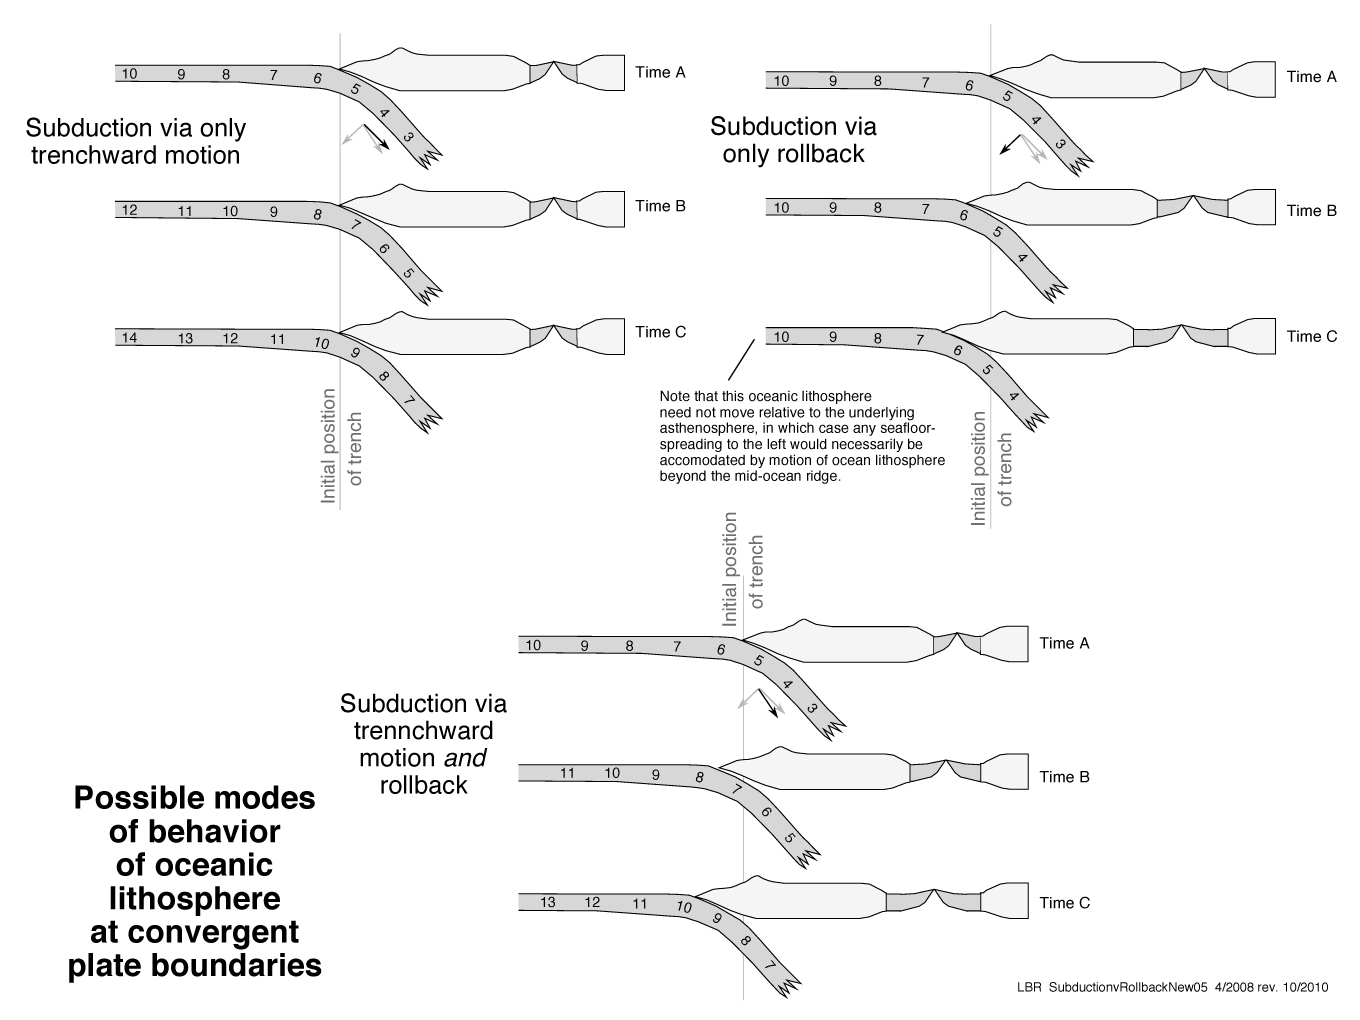
2. This diagram illustrates as two end-members the processes by which oceanic lithosphere can be envisioned as descending into Earth's interior. One end-member, shown in a three-step time series, is subduction via trenchward motion and slippage down a inclined path that does not itself move, so that any one piece of lithosphere follows the path taken by another piece of lithosphere originally trenchward of it. In this case, the trench does not move. The other end-member, likewise shown in a three-step time series, is rollback, the foundering and sinking of oceanic lithosphere wherein any one piece sinks, rather than slides, into Earth's interior. In this case, the trench must move seaward, or "roll back". In between these end-members is the intermediate case, also shown in a three-step time series, that combines sinking (rollback) and sliding (subduction sensu strictu).
 |
Entire document as a jpeg Entire document as a pdf
|
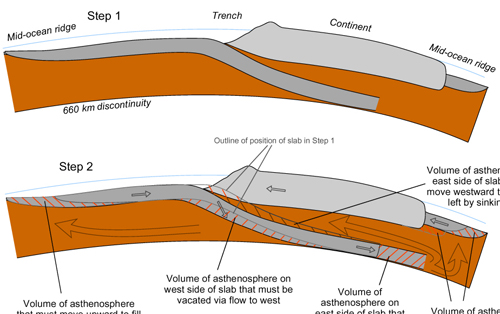
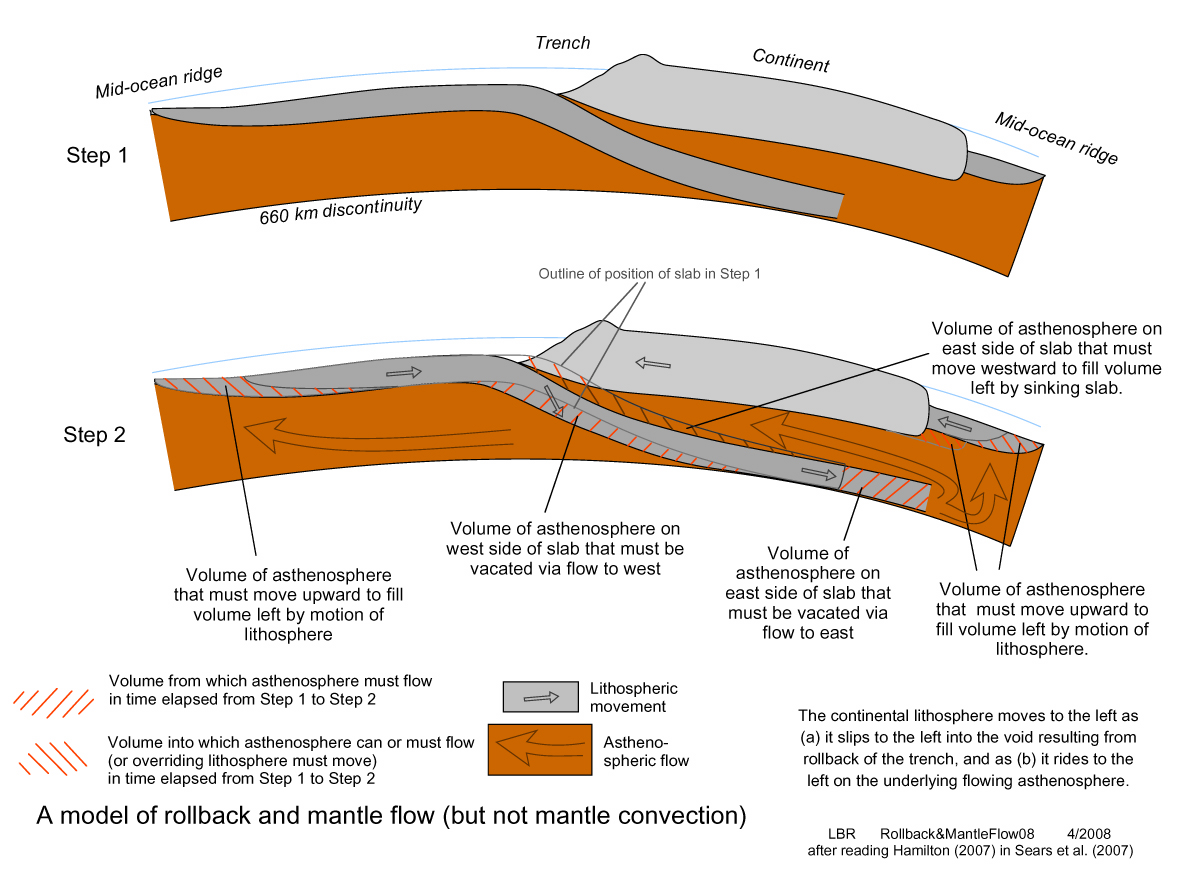
3. With the introduction to both rollback and subduction provided in Part 2, we can deepen our attempt to understand plate motions by envisioning the asthenospheric flow driven by subduction (sensu strictu) and rollback. In the two-step cross-sections linked here, diagonal lines indicate the regions from which or into which asthenosphere would flow as the result of lithospheric plate movement. The point is that displacements associated with subduction and rollback lead to asthenospheric flow that could account for movement of continental lithosphere and for upwelling of asthenosphere at divergent plate boundaries. This diagram draws heavily on Figure 17 of Hamilton (2007) but is also inspired by Anderson (2001).
The cross-sections are somewhat Hamiltonian in assuming that the 660-kilometer discontinuity is a boundary below which slabs do not sink and through which the asthenosphere does not flow. However, that assumption here is used more as a way to limit the size of the diagram than on account of any conviction about boundaries within the asthenopshere. The displacements shown would be as effective in a deeply circulating asthenosphere.
 |
Entire document as a jpeg Entire document as a pdf |
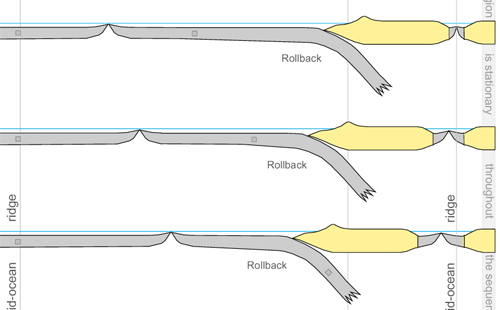
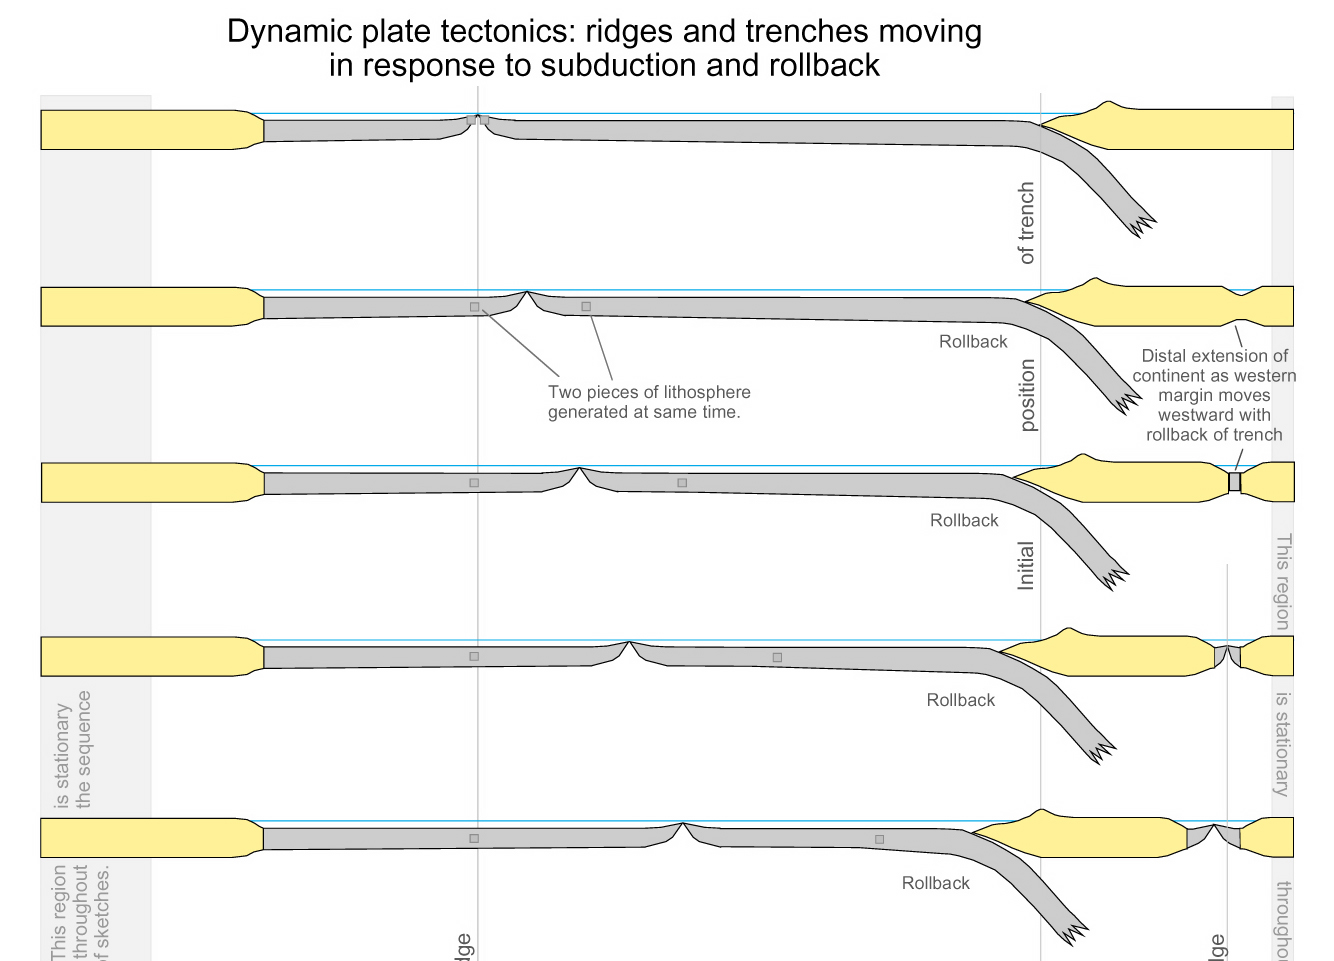
4. With the linkage of plate movement to subduction and/or rollback established in Parts 2 and 3 above, we can now envision how plate tectonic boundaries could move in response to subduction and/or rollback. The series of nine simplistic cross-sections used here shows the evolution of plates and boundaries, largely in response to subduction and rollback at a convergent plate boundary at the east side of the cross-sections. The mid-ocean ridge moves as a passive crack with addition of new lithosphere on each side of the divergent plate boundary. Positions of trenches move seaward with rollback. Back-arc extension occurs with motion of continental margins seaward as the result of rollback of trenches. Compression in the eastern convergent plate boundary occurs when young and more buoyant ocean lithosphere is subducted late in the series, but not necessarily early on. In short, things change: it's dynamic plate tectonics.
For what it's worth, this series of sketches could be envisioned as a highly schematic model for plate tectonics from west of Lake Baikal (at the left end of the sections) across the Pacifc, the Americas, and the Atlantic, to Europe or Africa (at the east end of the sections). However, caveat emptor.
 |
Entire document as a jpeg Entire document as a pdf
The first (top) five panels as a jpeg |
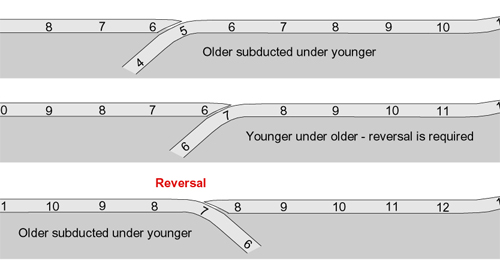
5. If the multi-step presentation in Part 4 above is dynamic in presenting a change plate-tectonic earthscape, it is nonetheless underlain by the quite reasonable static assumption that directions of subduction will not change at convergent plate boundaries where oceanic lithosphere descends beneath continental lithosphere. That static assumption does not hold at convergent plate boundaries where oceanic lithosphere descends beneath oceanic lithosphere. In the oceanic-oceanic case, it's commonly accepted that older (and therefore cooler and therefore more dense) oceanic lithosphere descends beneath younger (and therefore warmer and therefore more buoyant) oceanic lithosphere. In this case, direction (or "polarity") of subduction can change as older oceanic lithosphere of the descending plate is lost and only younger lithosphere remains in that plate. In fact, the sketches here would suggest that changes in the direction of subduction should be the rule, rather than the exception, as older lithosphere is destroyed.
 |
Entire document as a jpeg Entire document as a pdf |
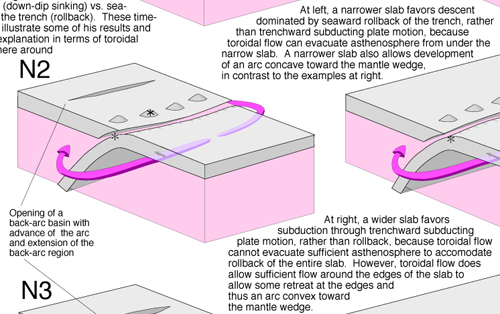
6. Parts 2 to 5 have been two-dimensional vertical cross-sections that ignore changes along a convergent plate boundary. Part 6 instead considers variation in subduction as the result of variation in width of the subducting slab in the boundary-parallel direction. Flow of asthenosphere around the edges of the slab leads to curvature of the slab's hingline. The result is an arc, rather than a linear convergent plate boundary, with the form of the arc dependent on the width of the slab.
 |
Entire document as jpeg Entire document as pdf
|
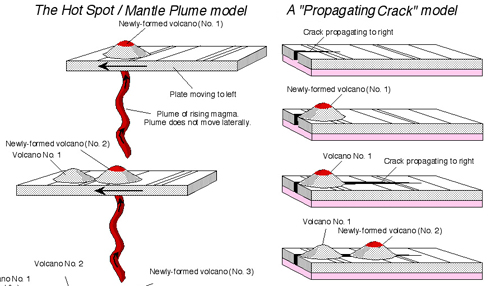
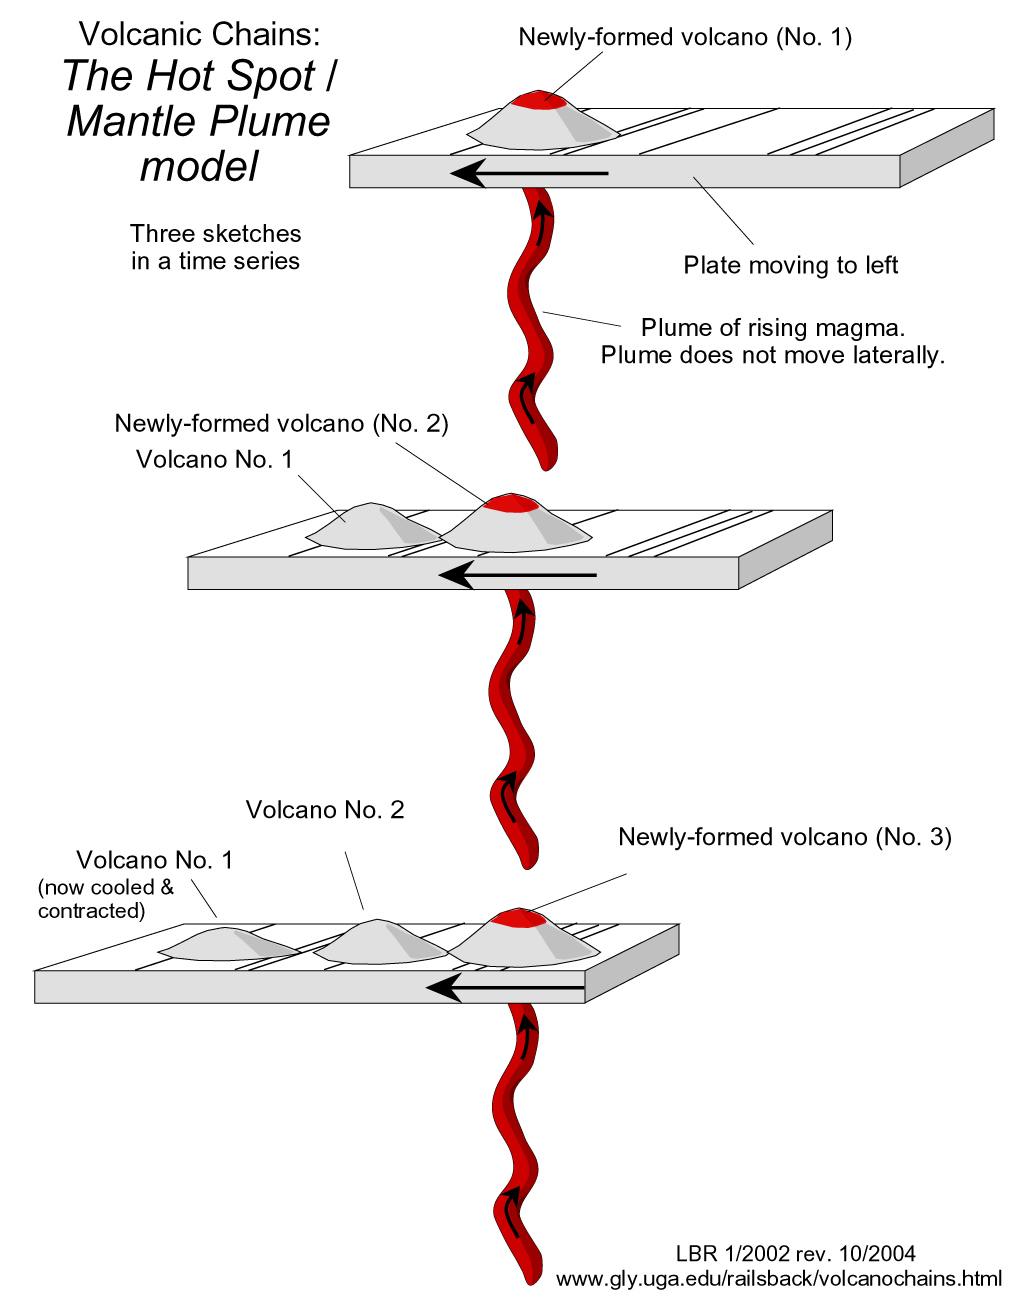
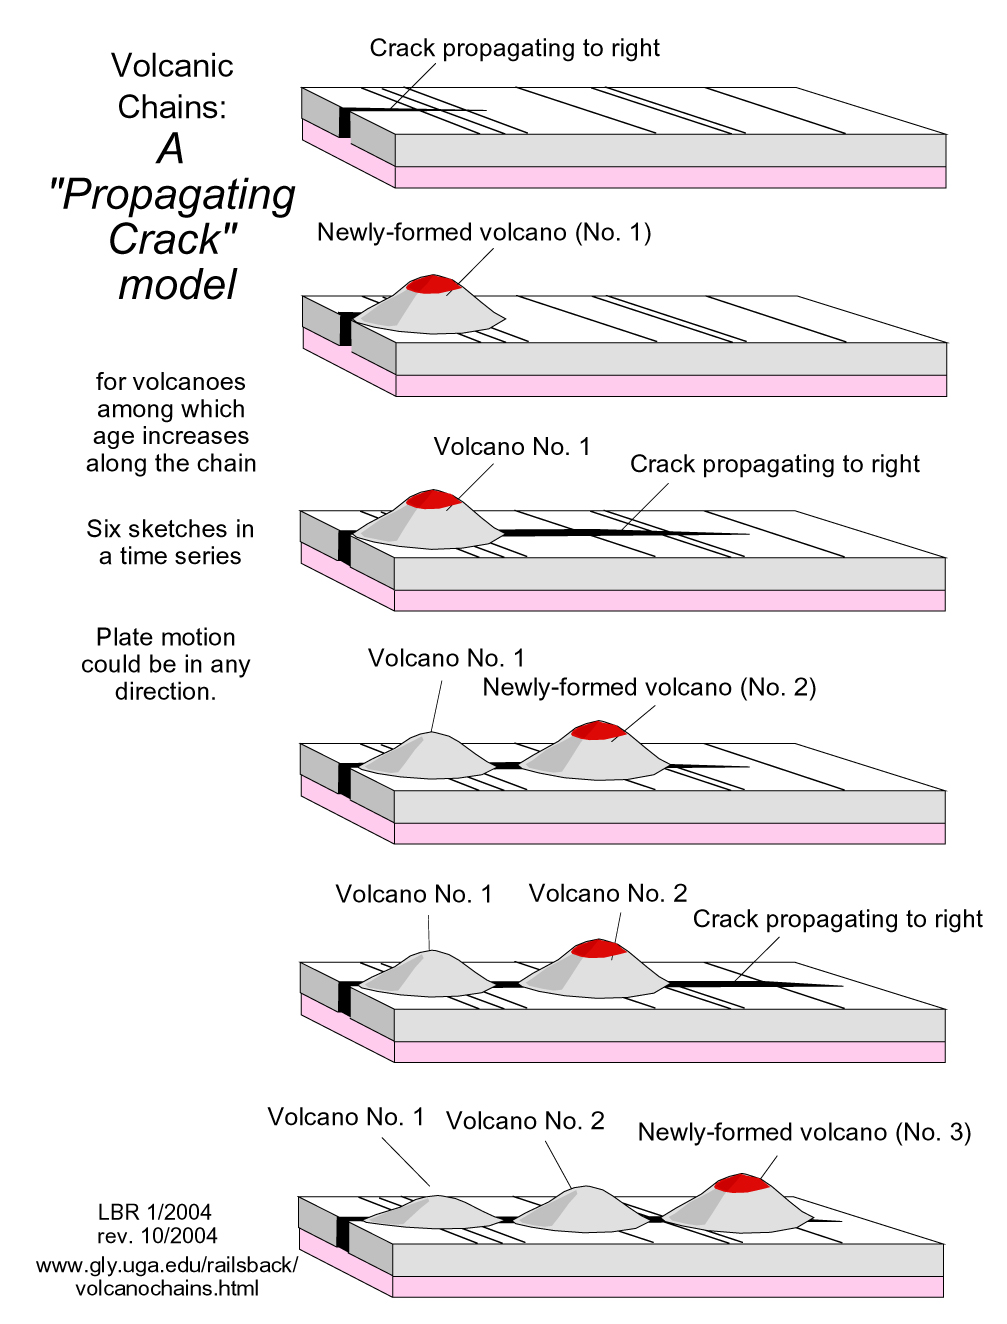
7. One widely recognized result of plate dynamics is the generation of series of volcanic seamounts and/or ocean islands. The two time-series sketches below illustrate two models for the origin of these features. One is the traditional model of hot-spot volcanism with a moving plate over a plume originating deep in the mantle. The other is an alternate model in which seamounts and/or ocean islands form sequentially over a propagating crack. For more alternatives, see another webpage and/or of course Foulger et al. (2005) and Foulger and Jurdy (2007).
 |
Traditional plume model, as jpeg Traditional plume model, as pdf
Alternate crack model, as a jpeg |
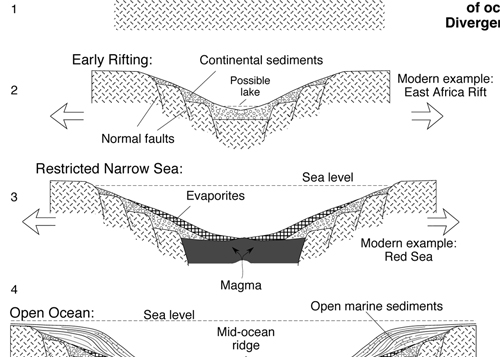
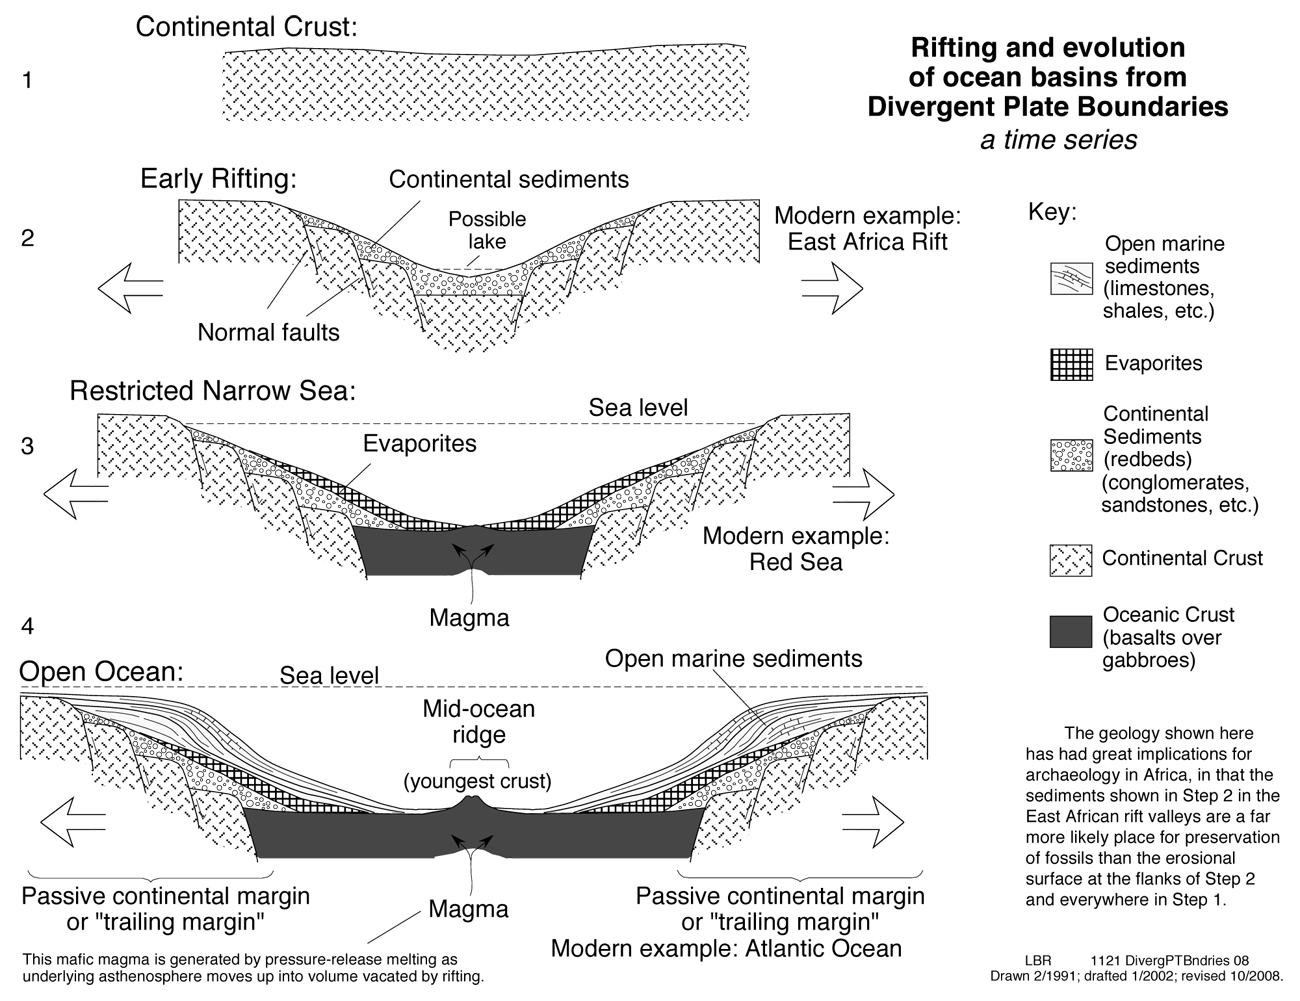
8 Part 5 illustrates change in convergent plate boundaries through time, but divergent plate boundaries change through time too. The sketches in the document below illustrate the stages through which a divergent plate boundary passes from early rifting of continent to mid-ocean ridge of a full-blown ocean.
 |
Entire document as a jpeg Entire document, as a pdf
|
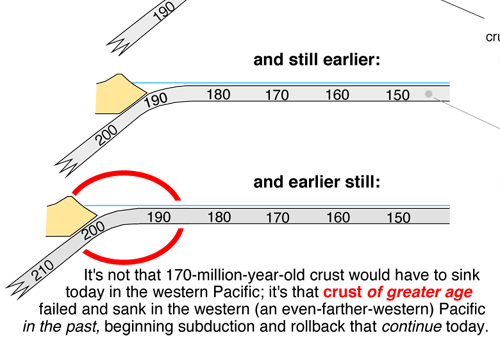
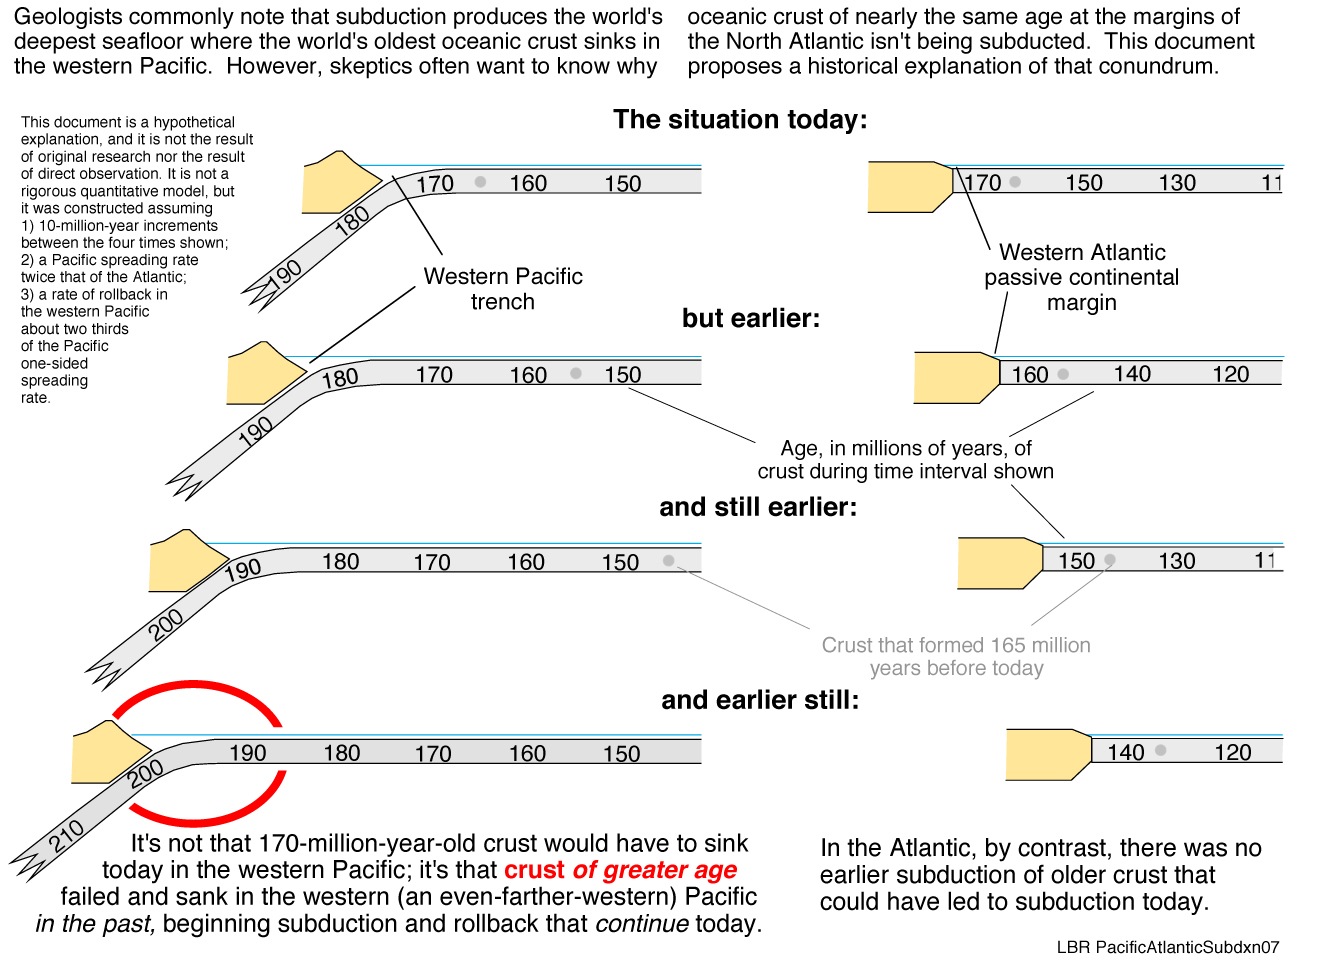
9. One great generalization of our understanding of plate tectonics is that dense oceanic lithosphere sinks into Earth's interior, and that older oceanic lithosphere is more likely to sink because it has had time to cool and thus is more dense. However, there is oceanic lithosphere in the North Atlantic (and elsewhere) as old as the lithosphere that sinks in the western Pacific in the oceans' deepest trenches (i.e., at our prototypical "old crust goes here to die" convergent plate boundary). Why does old oceanic lithosphere in the western Pacific sink when oceanic lithosphere of the same age in the North Atlantic does not? The time-series of sketches below provides a possible answer to that question.
 |
Entire document as a jpeg Entire document as a pdf
|
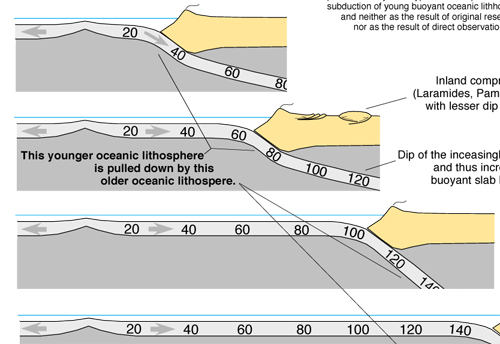
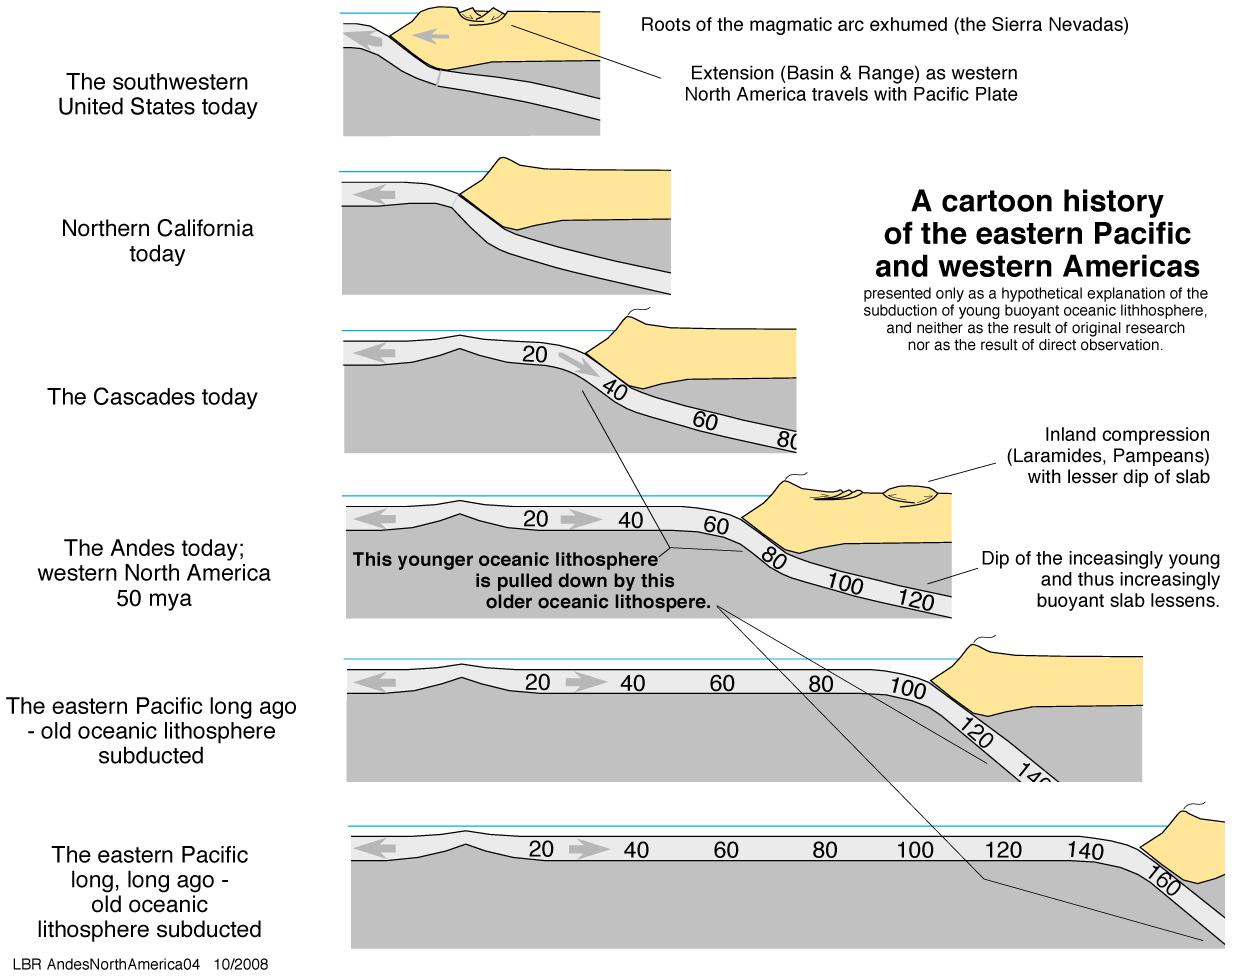
10A. As Part 9 observed, we generalize that older oceanic lithosphere is more likely to sink because it has had time to cool and thus is more dense. That explains the subduction zones of the western Pacific. However, much younger lithosphere is presently subducted, and has been subducted, in the eastern Pacific. As in Part 9, the time-series of sketches below proposes that history influences modern subduction, especially in a closing ocean basin that was once wider. Part 10B below provides a perspective more nearly drawn to scale.
 |
Entire document as a jpeg Entire document as a pdf
|
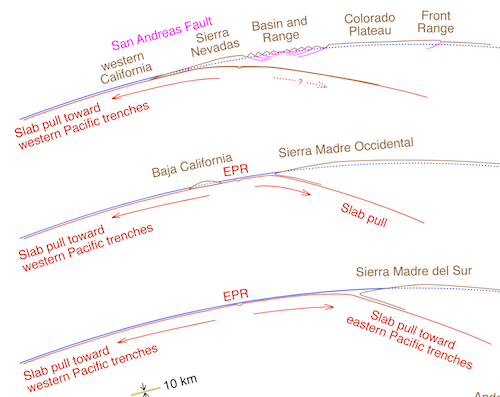
10B. Here is a time-series or geographic-series for the eastern Pacific drawn with much less vertical exaggeration.
 |
Entire document as a jpeg Entire document as a pdf
|
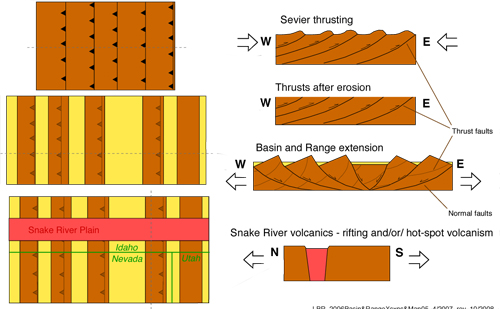
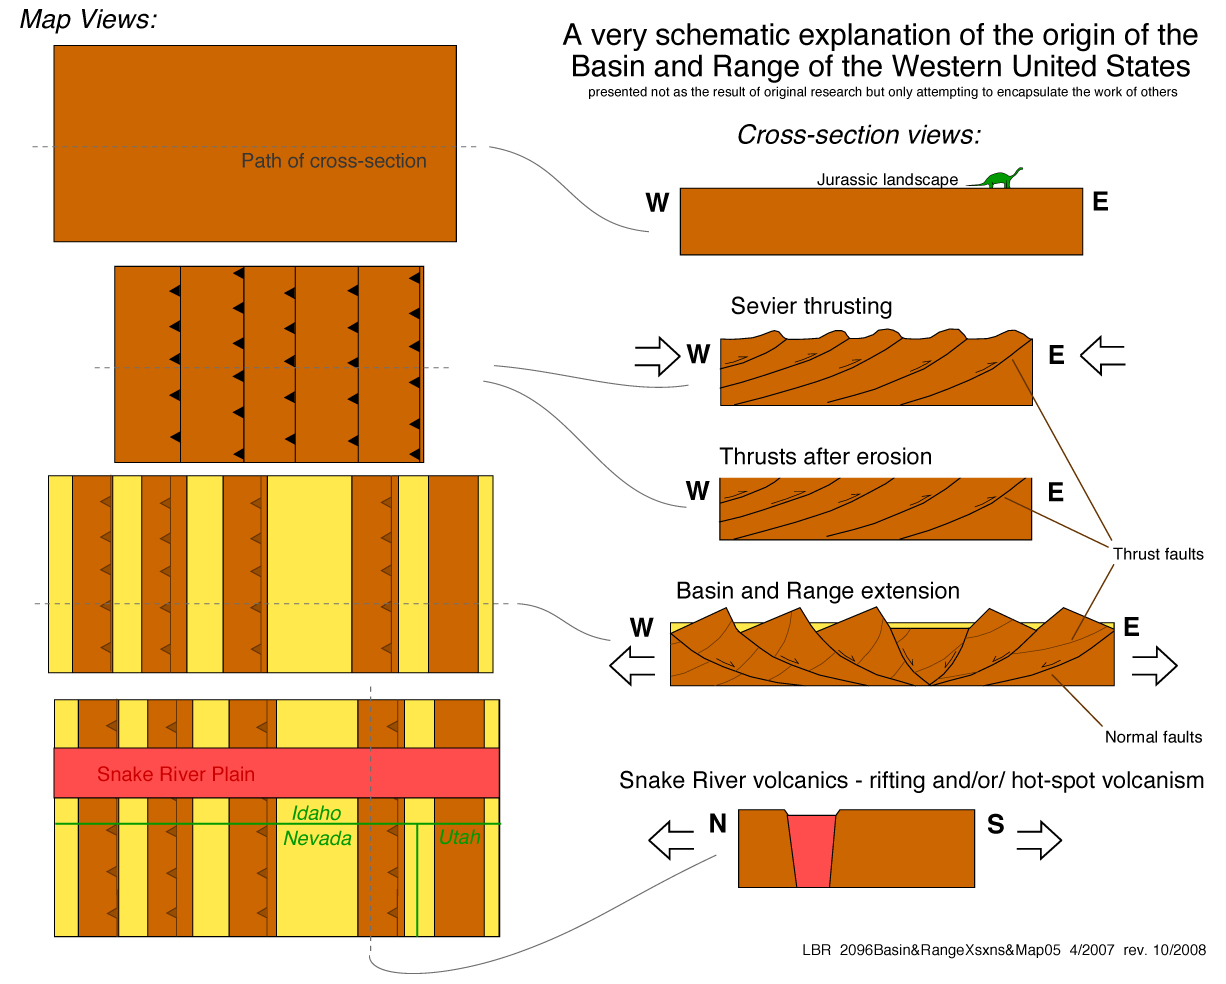
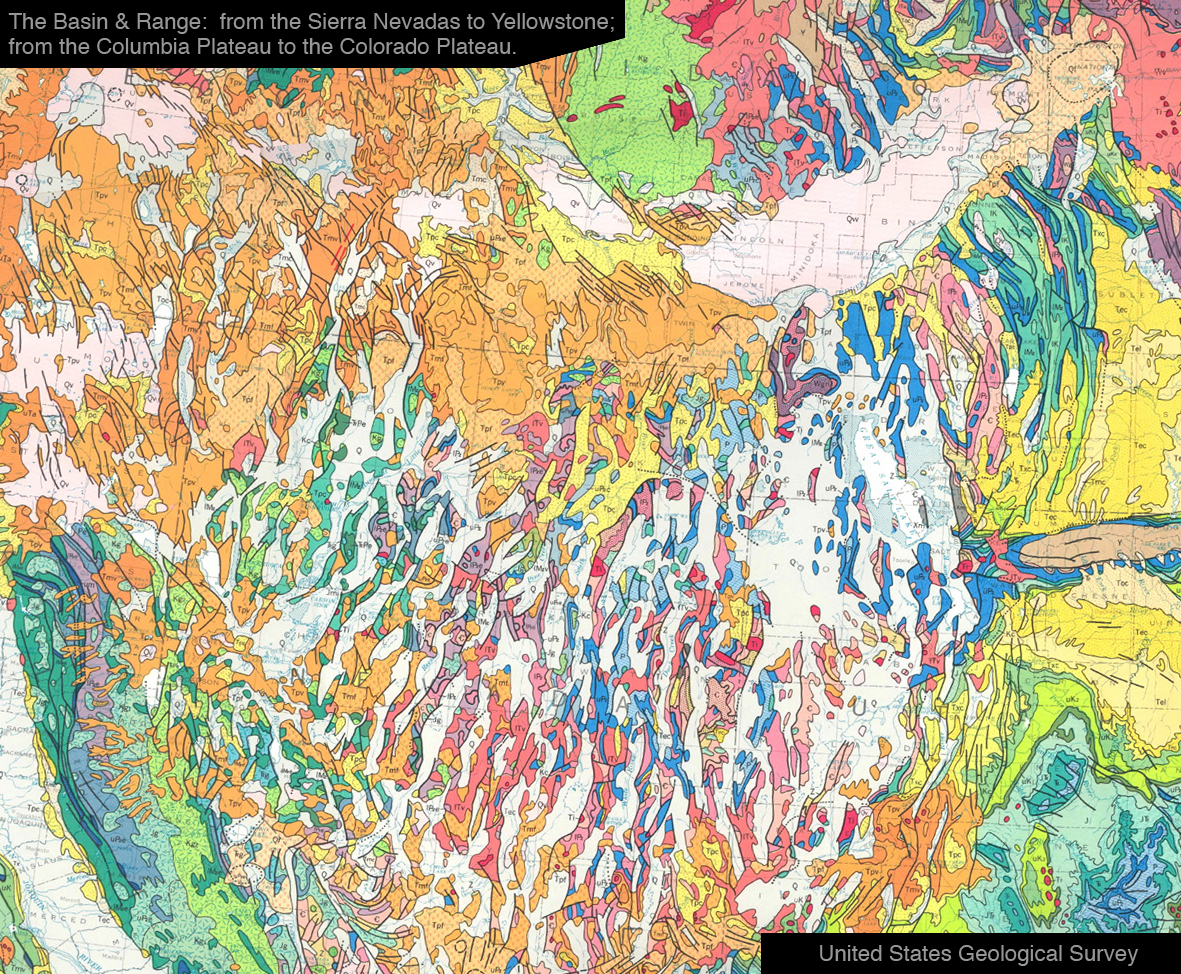
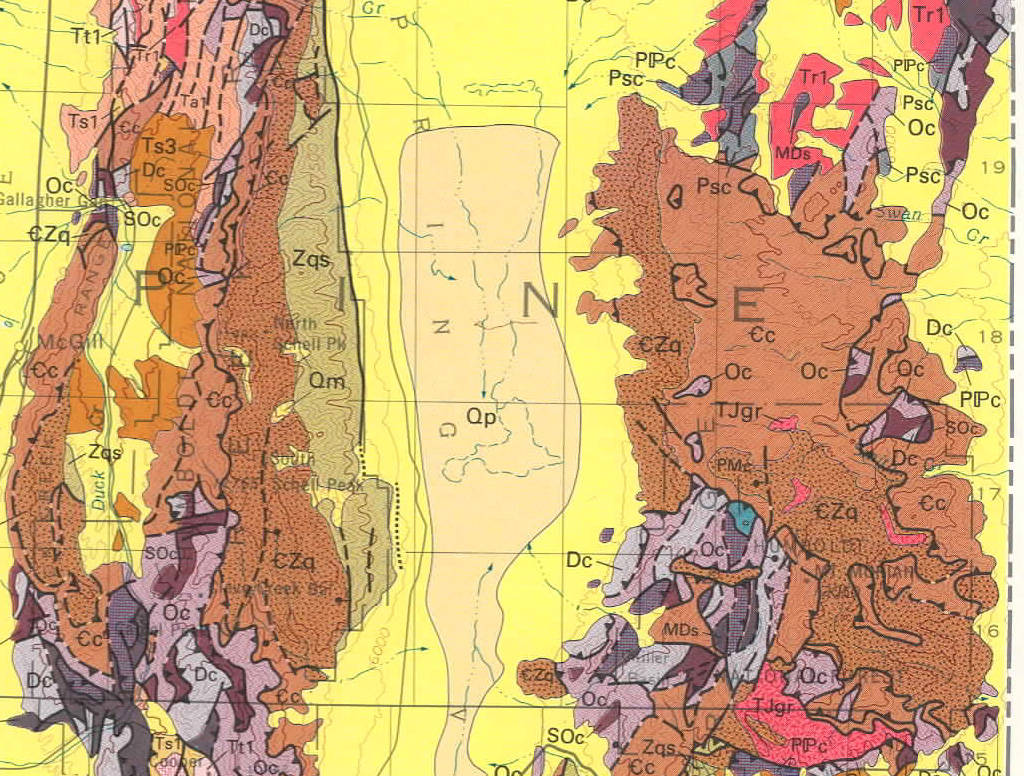
11. Part 10 brought us to the western margins of the Americas and to the change from compression to extension in the southwestern United States. The document below focuses on that change with a time series of very schematic sketches regarding the Basin and Range of the southwestern United States. As a supplement, there are also links to images of geologic mapping of the Basin & Range and of the old thrust faults in the more recent mountain ranges that are bounded by normal faults.
_______________
References cited:
Anderson, D.L., 2001, Top-down tectonics?: Science, v. 293, p. 2016-2018.
Foulger, G.R, Natland, J.H., Presnall, D.C., and Anderson, D.L., eds., 2005, Plates, Plumes, and Paradigms: Geological Society of America Special Paper 388.
Foulger, G.R, and Jurdy, D.M., eds., 2007, Plates, Plumes, and Planetary Processes: Geological Society of America Special Paper 430, 974 p.
Hamilton, W.B., 2007, Driving mechanism and 3-D circulation of plate tectonics, in Sears, J.W., Harms, T.A., and Evenchick, C.A., eds., Whence the mountains? Inquiries into the evolution of orogenic systems: A volume in honor of Raymond A. Price: Geological Society of America Special Paper 433, p. 1-25.
Schellart, W.P., et al., 2007, Evolution and diversity of subduction zones controlled by slab width: Nature, v. 446, p. 308-311.
|
The documents linked above are cartoons drafted by Dr. Bruce Railsback for basic geology classes at the University of Georgia and in the University of New Orleans-Innsbruck summer program. They are not the results of original research, and they were drawn by neither a tectonicist nor an igneous petrologist nor a mantle dynamicist. Constructive feedback is welcomed. Educators are welcome to use these documents in their teaching, so long as the images are not reproduced in publications and are not used for financial gain. For use in publications or on other websites, send an email message to Bruce Railsback (rlsbk@gly.uga.edu).
e-mail to Bruce Railsback (rlsbk@gly.uga.edu)
The content and opinions expressed on this Web page do not necessarily reflect the views of, nor are they endorsed by, the University of Georgia or the University System of Georgia.
|