Photomicrograph was taken in plane-polarized light; field of view is 2.2 mm wide. Anjohibe Cave, Madagascar; Stalagmite MA2; thin section MA2-1. Sample collected by Dr. George A. Brook.
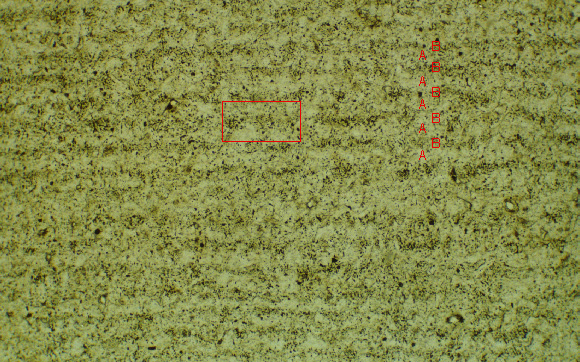
| Figure 7-10. Layers of clear (A) and inclusion-rich (B) calcite. Rafter (1997) showed that these layers differ in their Mg concentration and hypothesized that they represent different rates of crystallization. A
view in cross-polarized light shows the columnar crystals in which these layers occur, and a high-magnification view of the area outlined in red shows one of the inclusion-rich layers in greater detail. Photomicrograph was taken in plane-polarized light; field of view is 2.2 mm wide. Anjohibe Cave, Madagascar; Stalagmite MA2; thin section MA2-1. Sample collected by Dr. George A. Brook. |
|
|
|
| Back to the Table of Contents of the Atlas of Speleothem Microfabrics. |